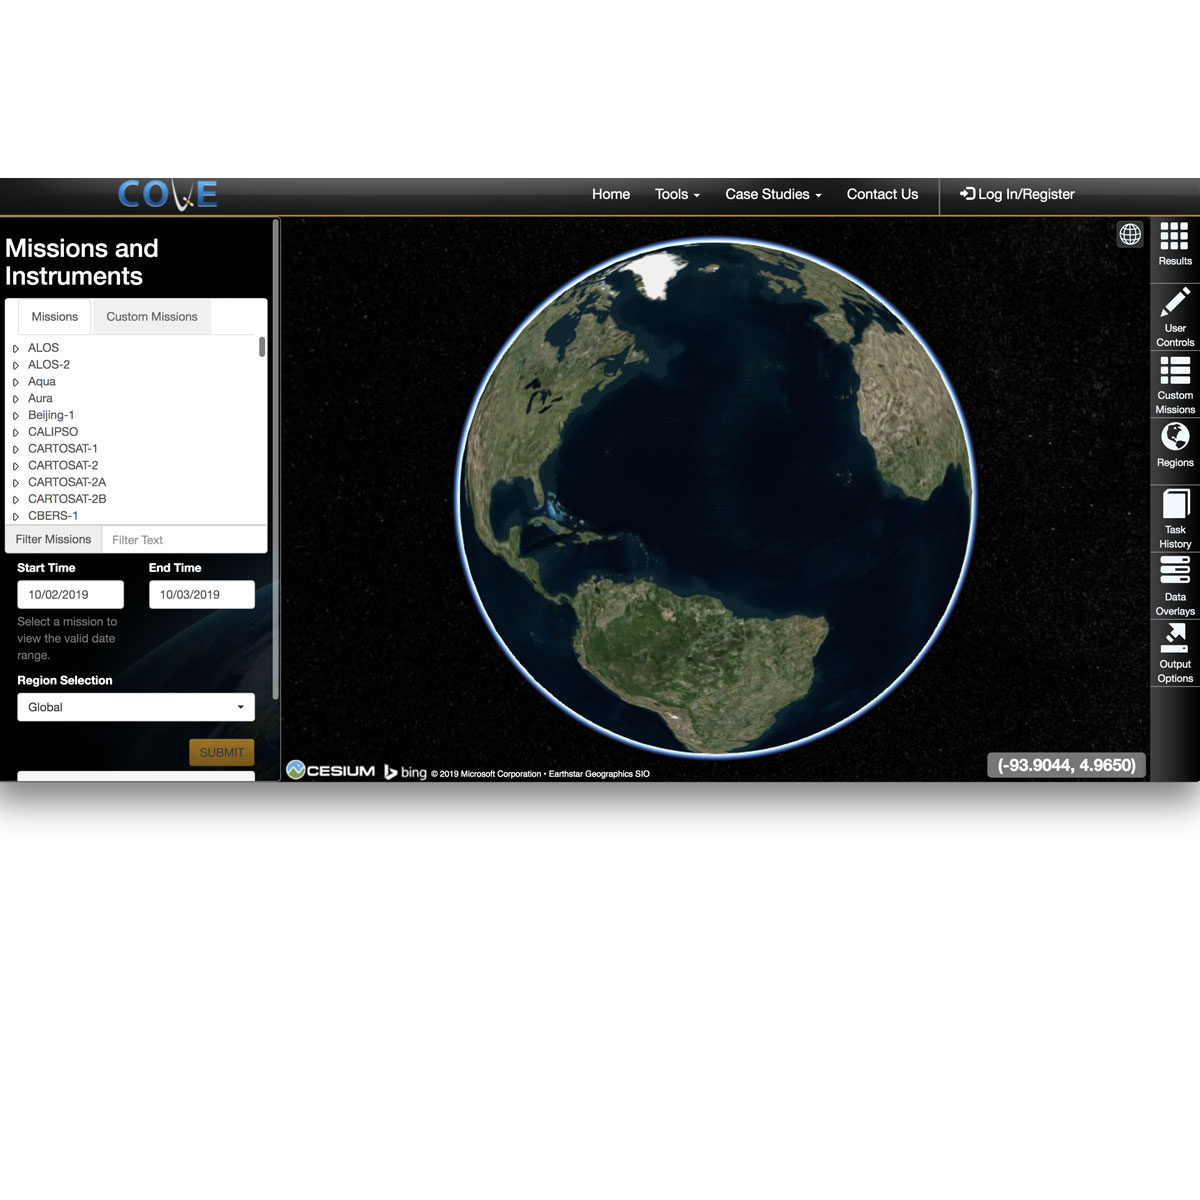
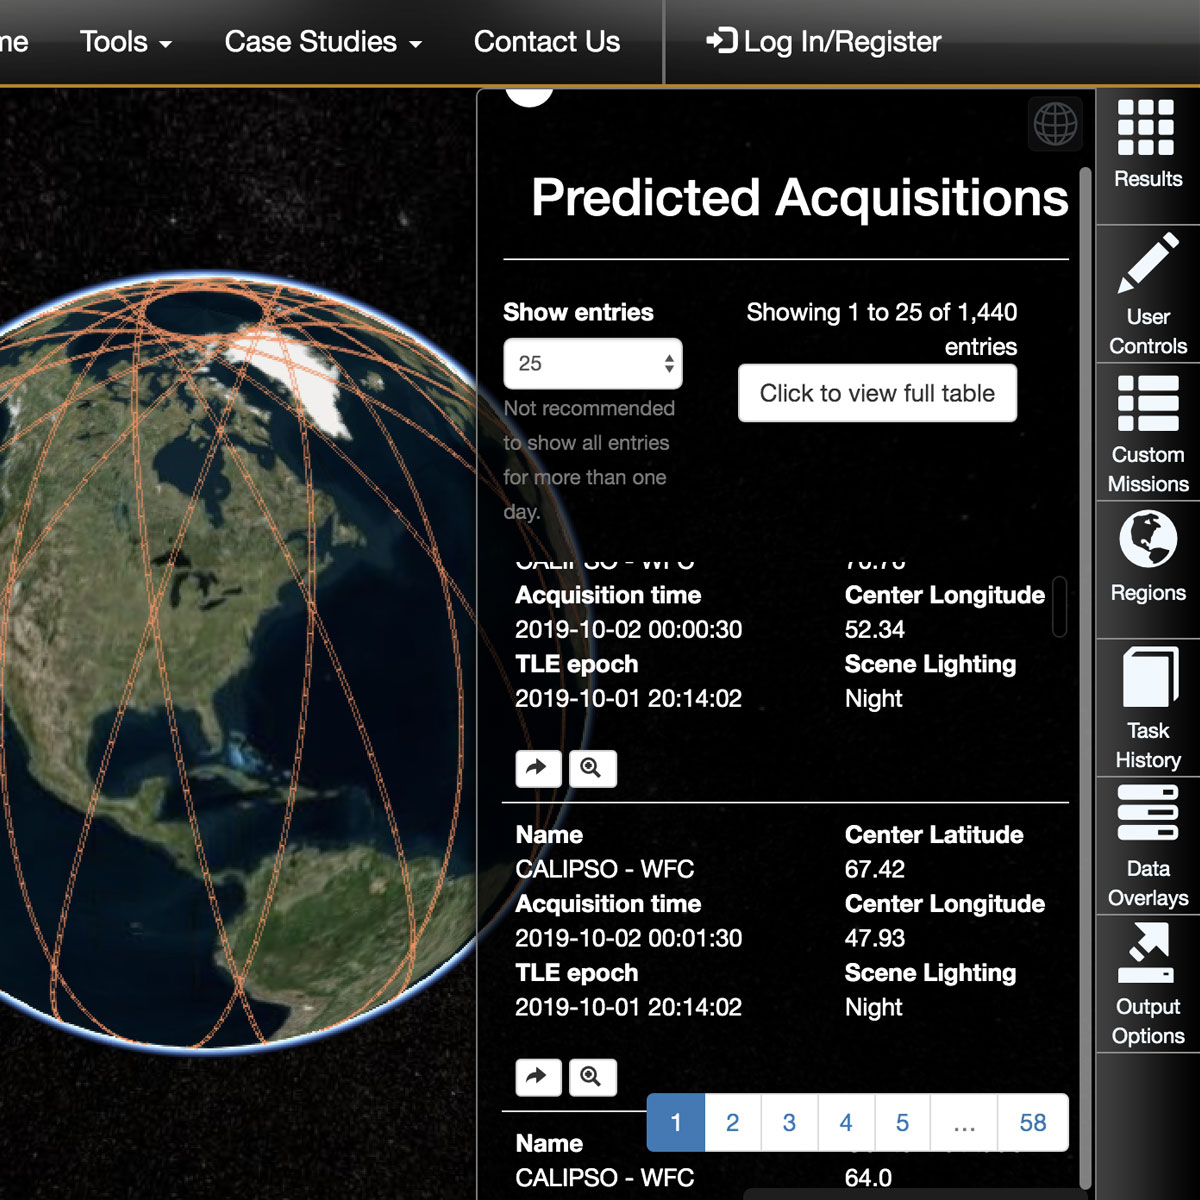
The CEOS Visualization Environment (COVE) tool is a browser-based system that leverages Google-Earth to display satellite sensor coverage areas and identify coincidence scene locations. Standard Calibration and Validation (Cal/Val) exercises to compare near-simultaneous surface observations and identify corresponding image pairs are time-consuming ...
Last Update: 2013
Data reporting Ecosystem structure Marine Terrestrial Plants
Login to add the tool into your favorites.
The CEOS Visualization Environment (COVE) tool is a browser-based system that leverages Google-Earth to display satellite sensor coverage areas and identify coincidence scene locations. Standard Calibration and Validation (Cal/Val) exercises to compare near-simultaneous surface observations and identify corresponding image pairs are time-consuming and labor-intensive. The COVE suite of tools has been developed to make such tasks easier. The suite currently consists of the following tools: • The COVE Tool enables users to visualize satellite instrument coverage tracks and calculate coincidences. The COVE Tool features real-time collaboration and support for multiple viewports. Some COVE data can be exported to STK scenarios. • The Rapid Acquisition Tool enables users to quickly identify potential acquisitions over specified regions. This acquisition data can be downloaded in .csv spreadsheet format. • The Mission and Instrument Browser allows users to view COVE's database of missions and instruments. The modeling assumptions for each mission/instrument are included.
| Contact person: | Brian D. Killough |
|---|---|
| Contact e-mail: | brian.d.killough@nasa.gov |
| Contact Organization: | CEOS Systems Engineering Office (SEO) |
| URL(s): |
https://ceos-cove.org
https://ceos-cove.org/media/acquisition_forecaster_for_Intercalibration_of_Satellite_Instruments.pdf |
Login to add a review for the tool The CEOS Visualization Environment (COVE)
TOOLS YOU MAY ALSO LIKE
