Author: The Genes from Space team
Developers: Francesco Nocera, Simon Pahls and Oliver Selmoni
Project coordinators: Meredith Schuman and Claudia Röösli
The Genes from Space team: Clement Albergel, Ghassem R. Asrar, Isabelle Helfenstein, Sean Hoban, Sophie Hebden, Santiago Lago, Linda Laikre, Deborah Marie Leigh, Katie Millette, Alicia Mastretta-Yanes, Michael E. Schaepman, Wolke Tobón Niedfeldt, Cristiano Vernesi
Contact: info@genesfromspace.org
Review status: Beta testing
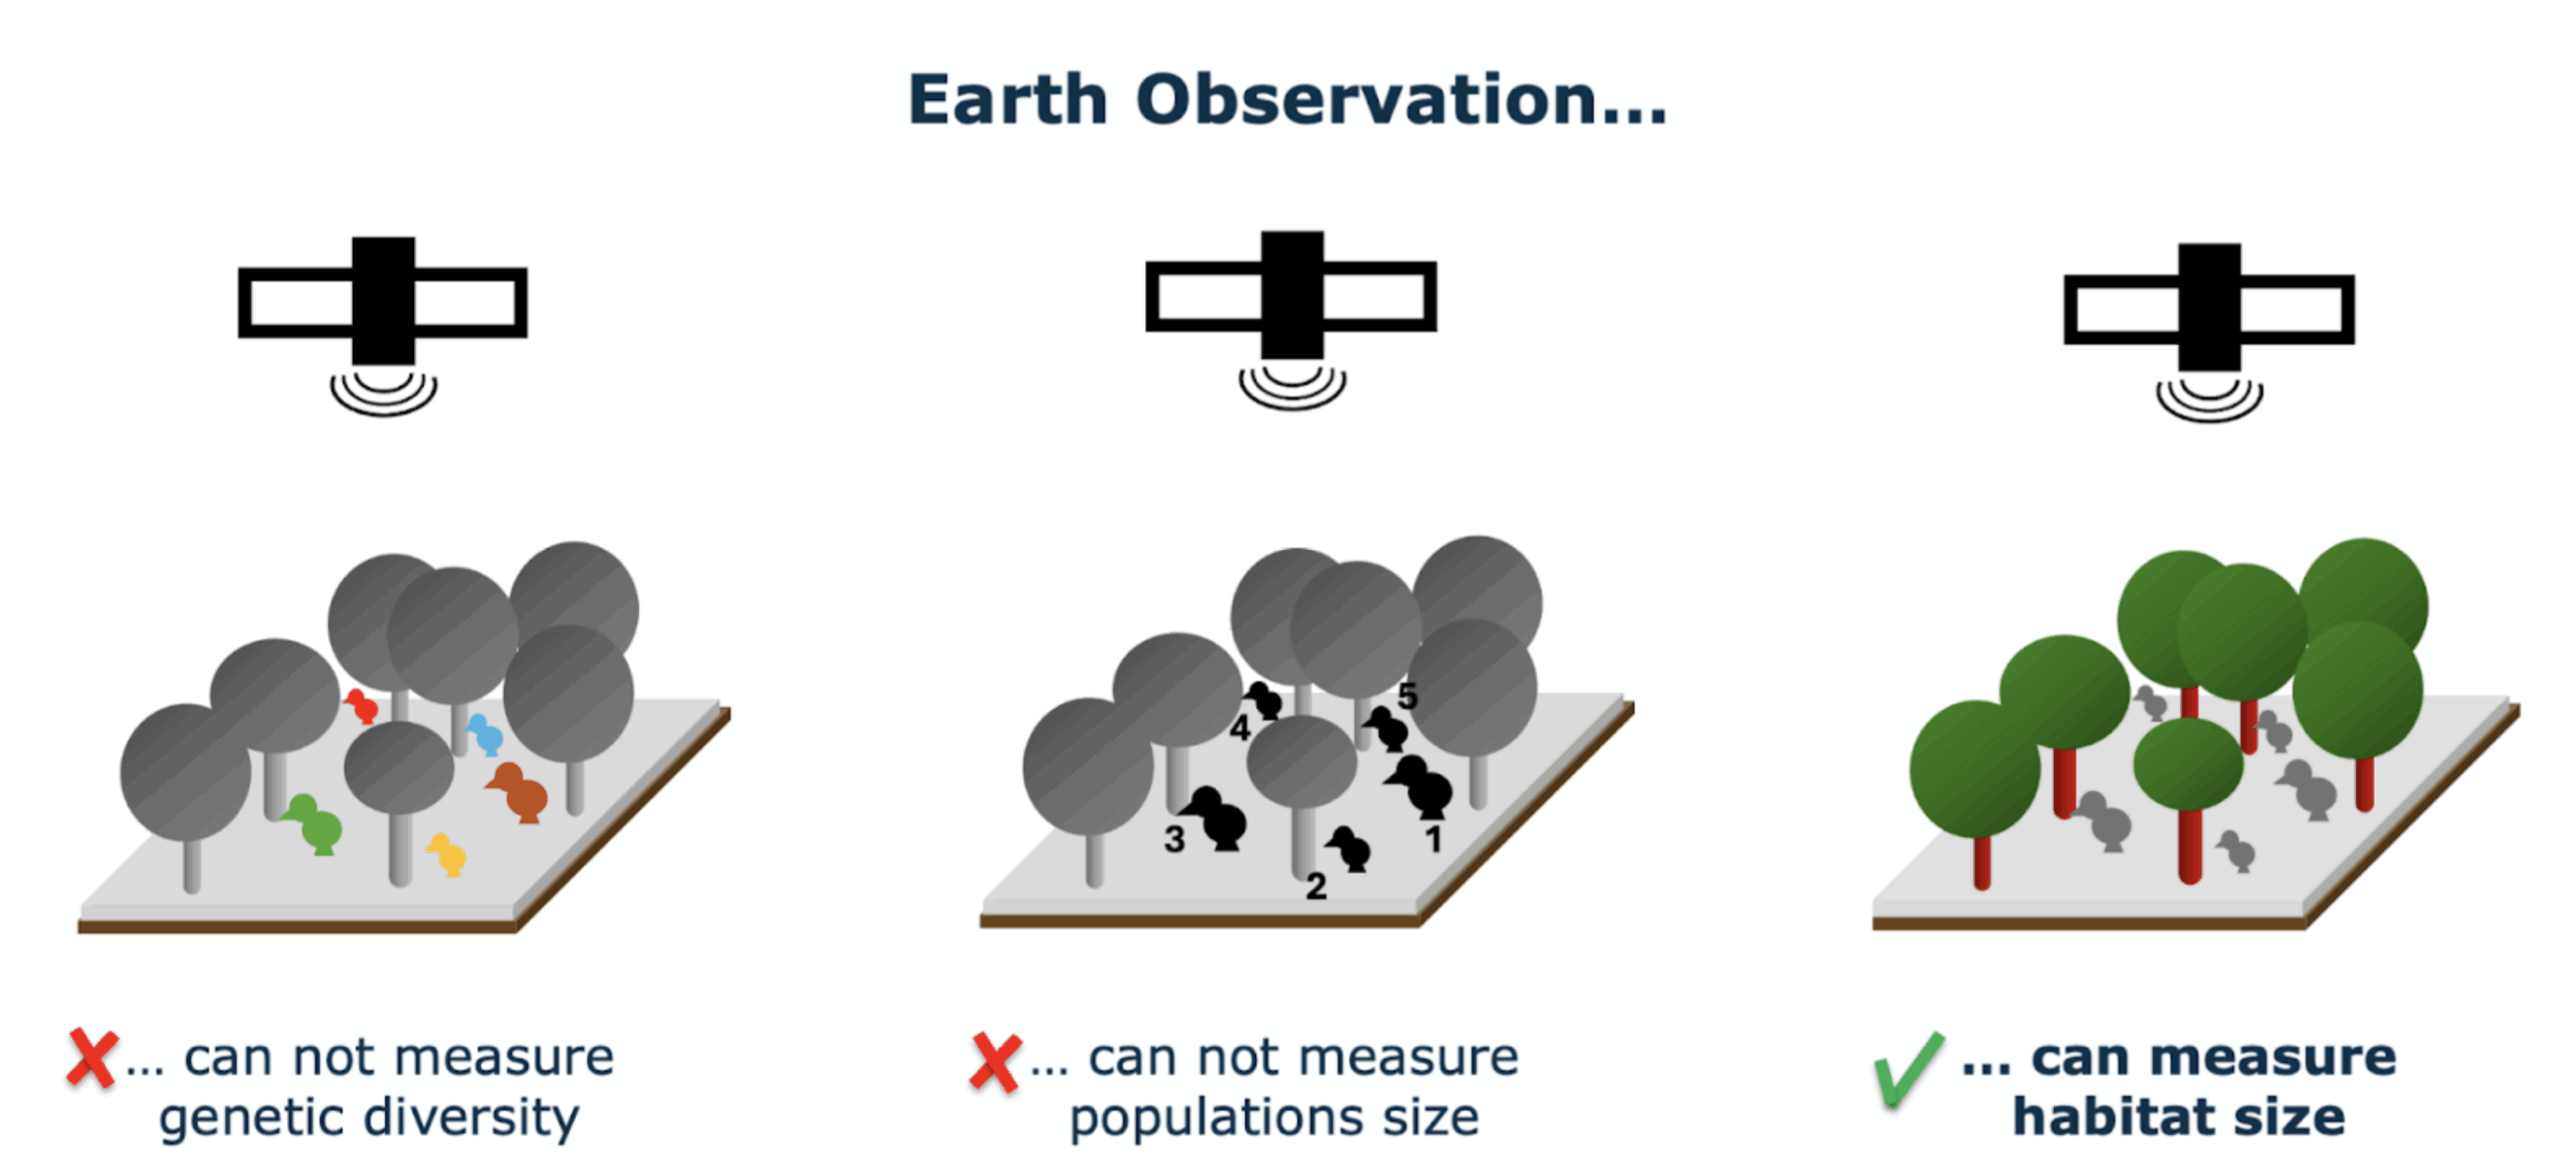
Species genetic diversity is a critical aspect of ecosystem health, but assessing it can be challenging due to the complexity of gathering and analyzing relevant data across large spatial scales. Traditional methods often require extensive fieldwork and labor-intensive sampling for DNA sequencing, which limits the frequency and scale of genetic diversity assessments. The Genes From Space monitoring tool in BON in a Box uses Earth Observations (EO) to track habitat changes over time and infer population trends as indicators of genetic diversity.
Leveraging public EO data, the tool enables users to calculate two genetic diversity indicators adopted by the Convention on Biological Diversity:
The tool provides an interface that simplifies the process of selecting EO datasets, running analyses, and interpreting genetic diversity indicators. Ultimately, this tool offers a more scalable and accessible solution for researchers, conservationists, and policymakers to monitor and protect biodiversity at local, regional, and global levels.
The tool process requires two main inputs:
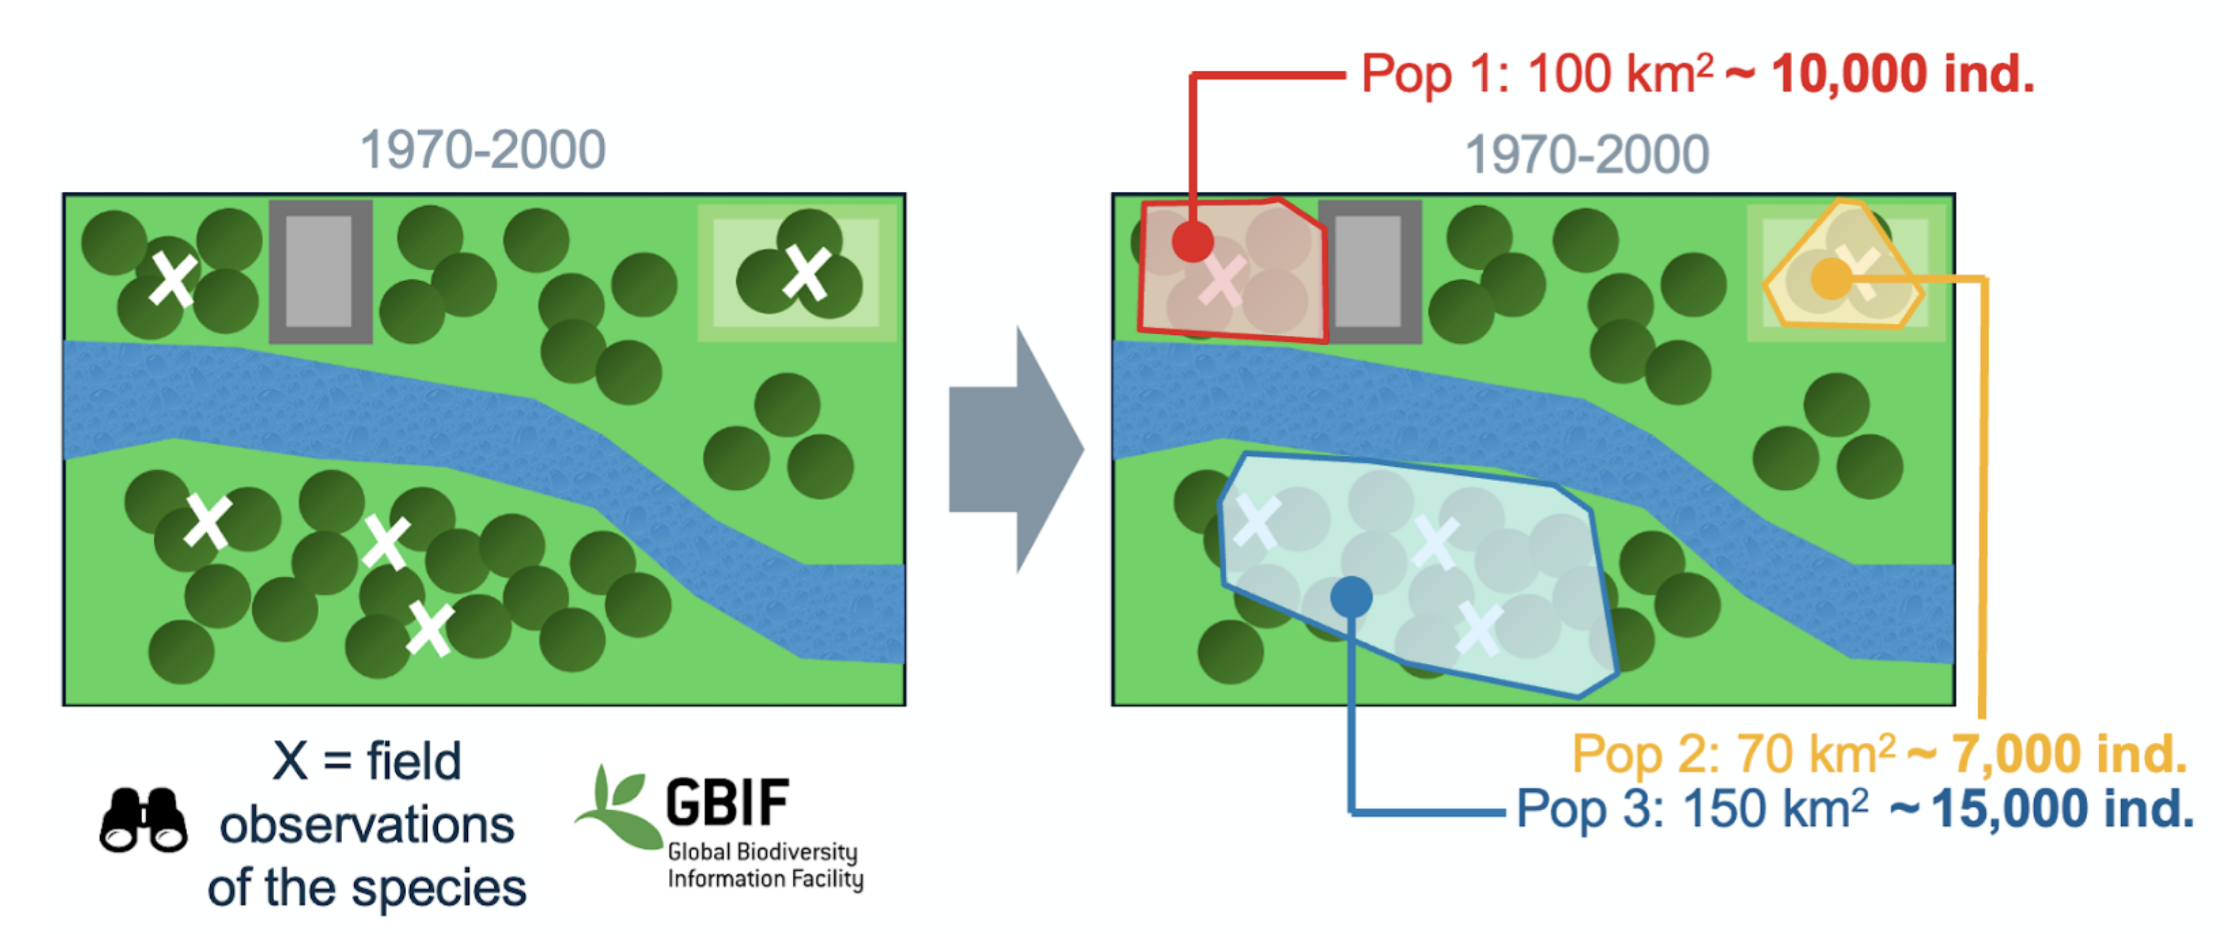
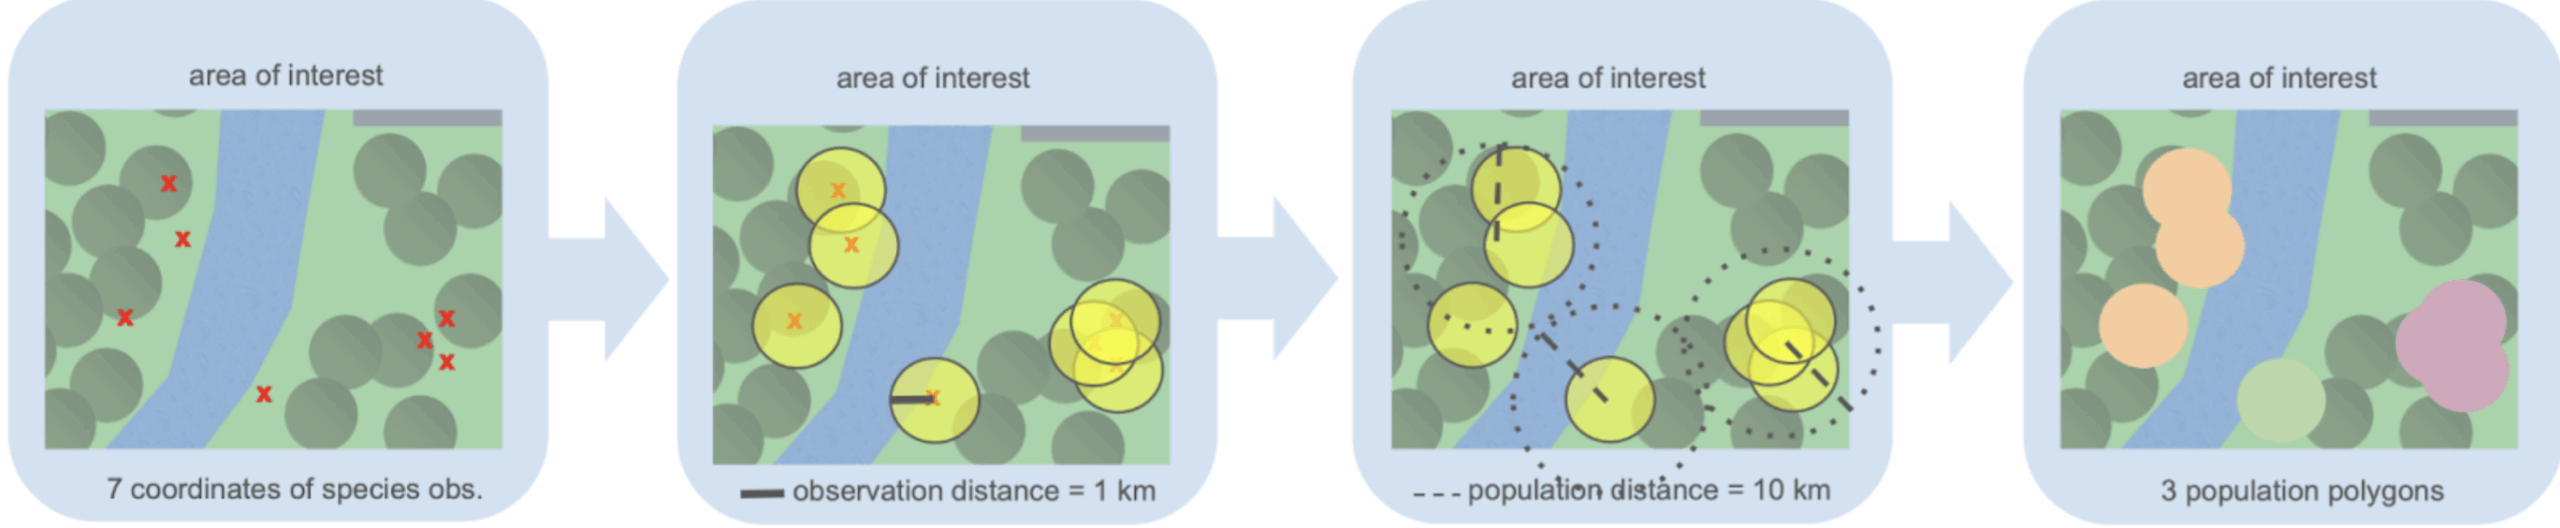
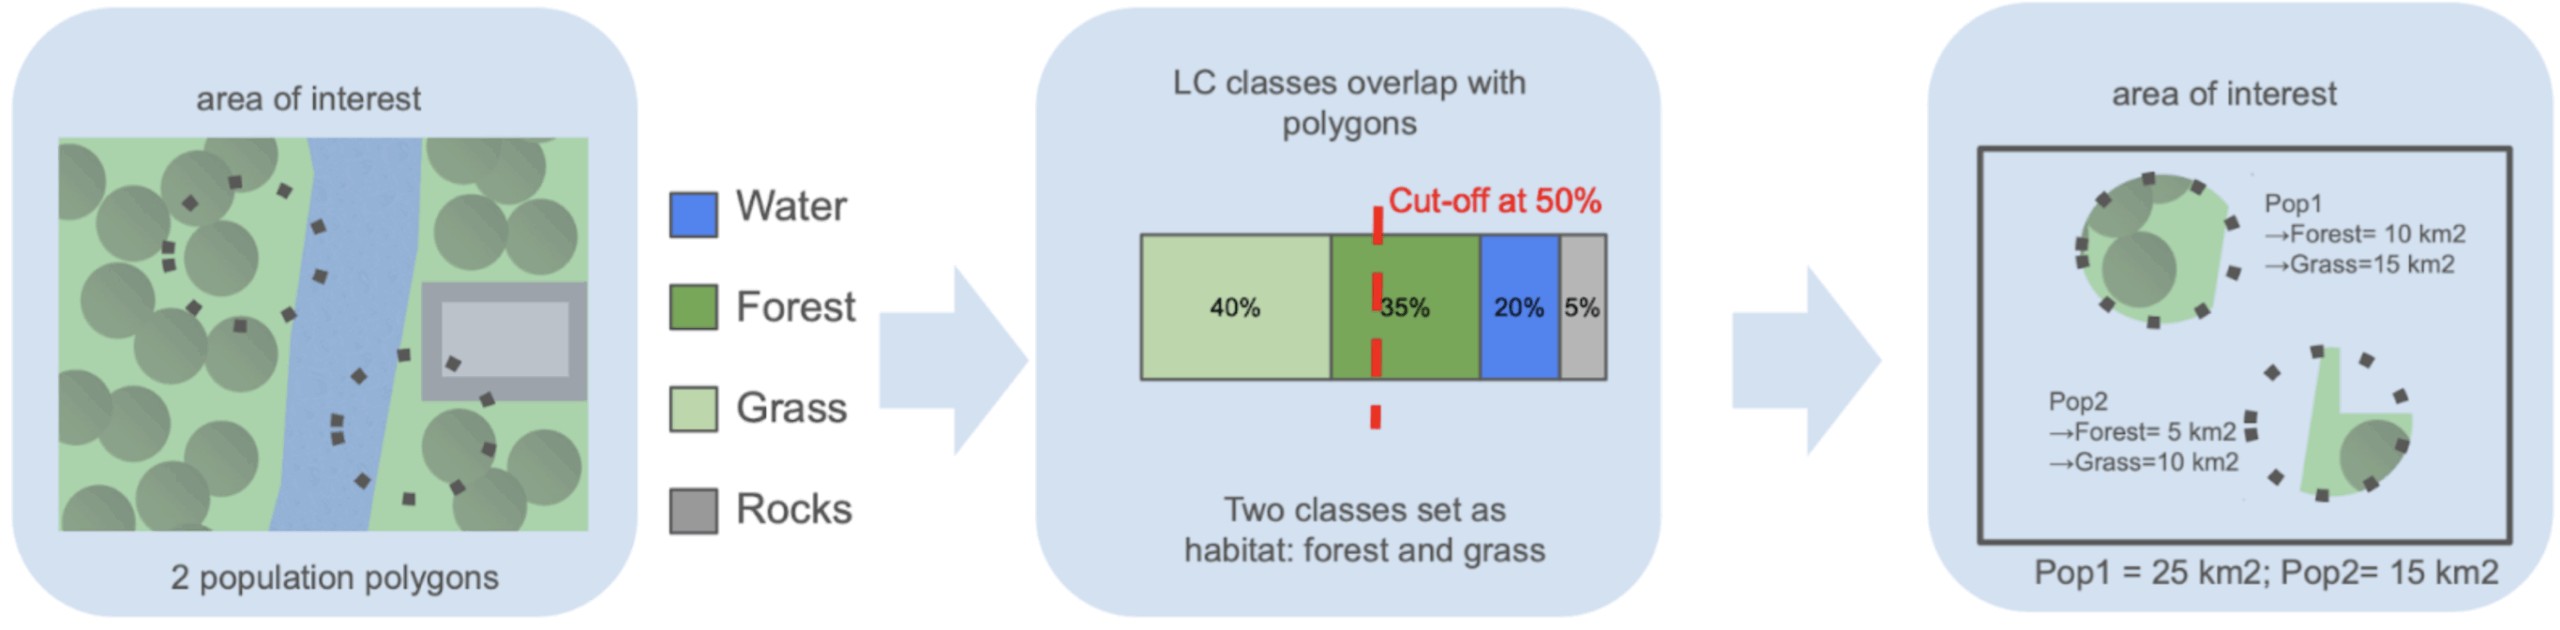
The processing steps used by the Genes from Space monitoring tool are implemented as BON in a Box scripts and pipelines. These steps include:
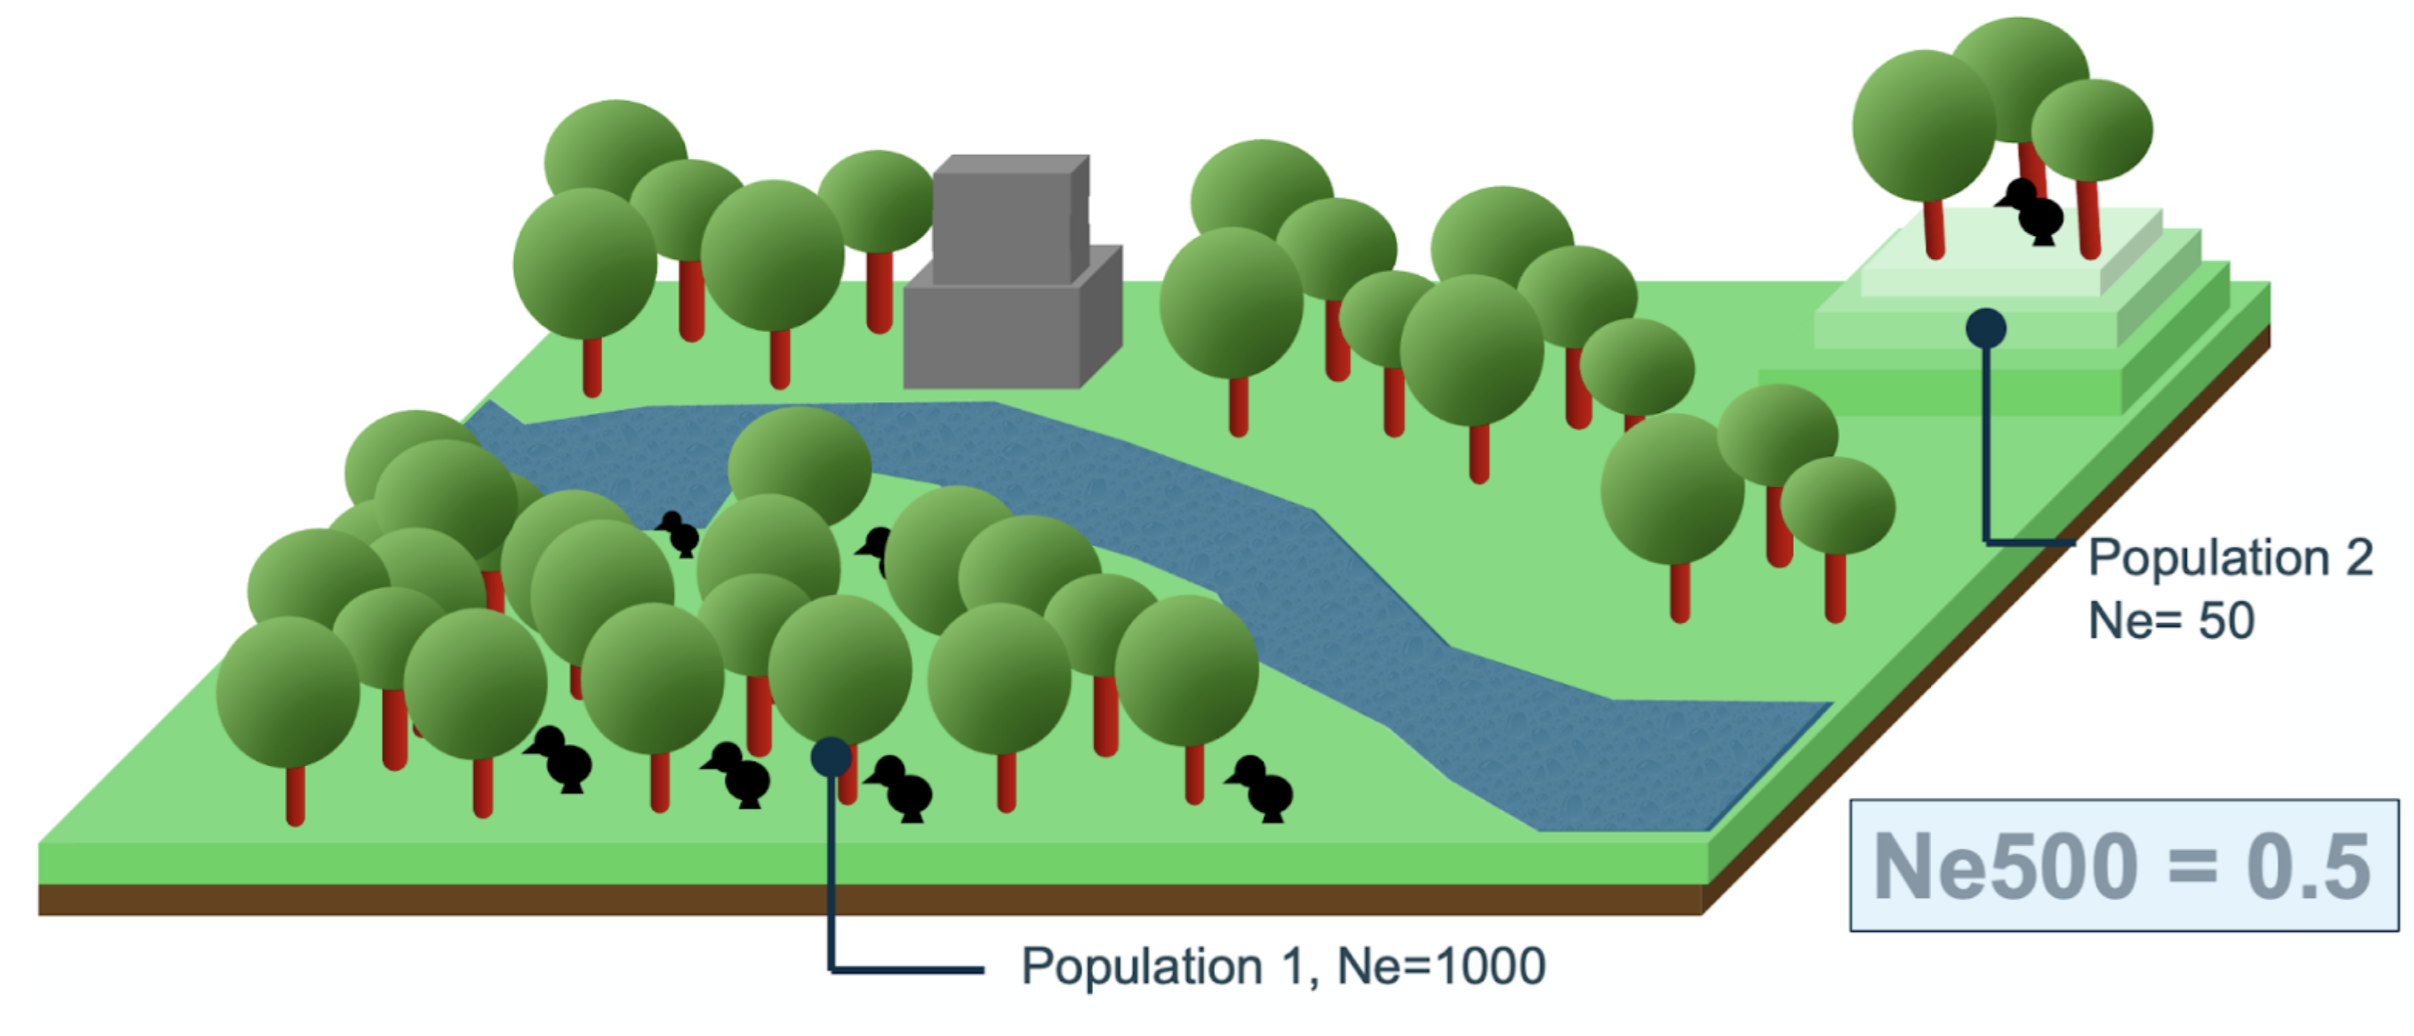
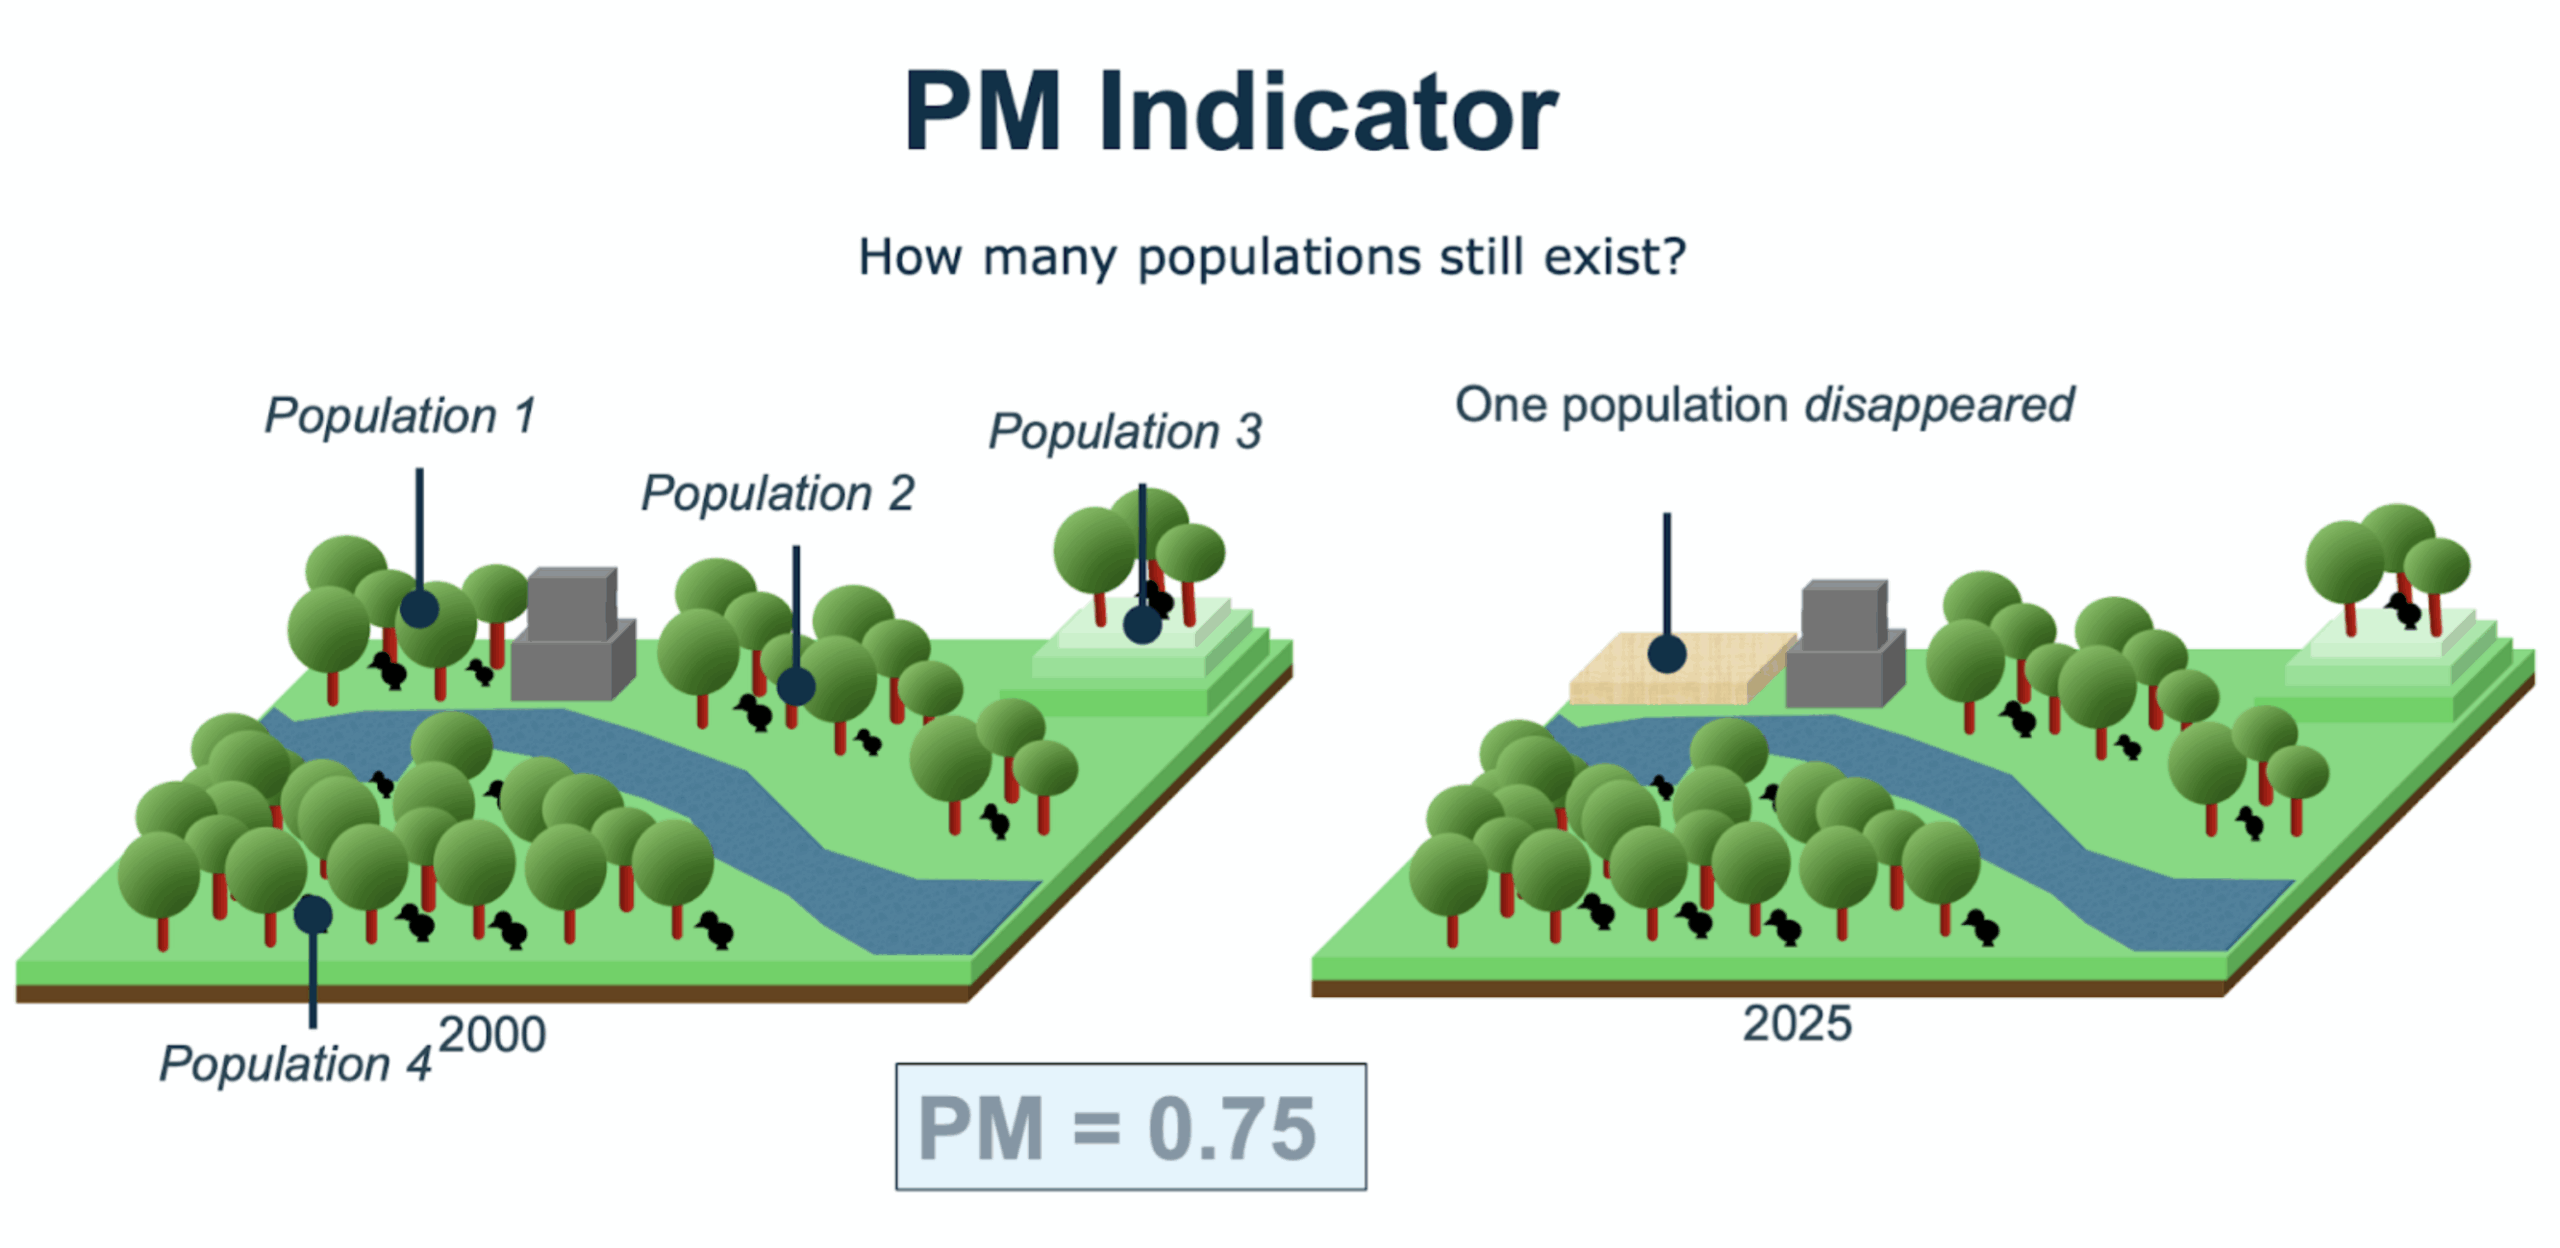
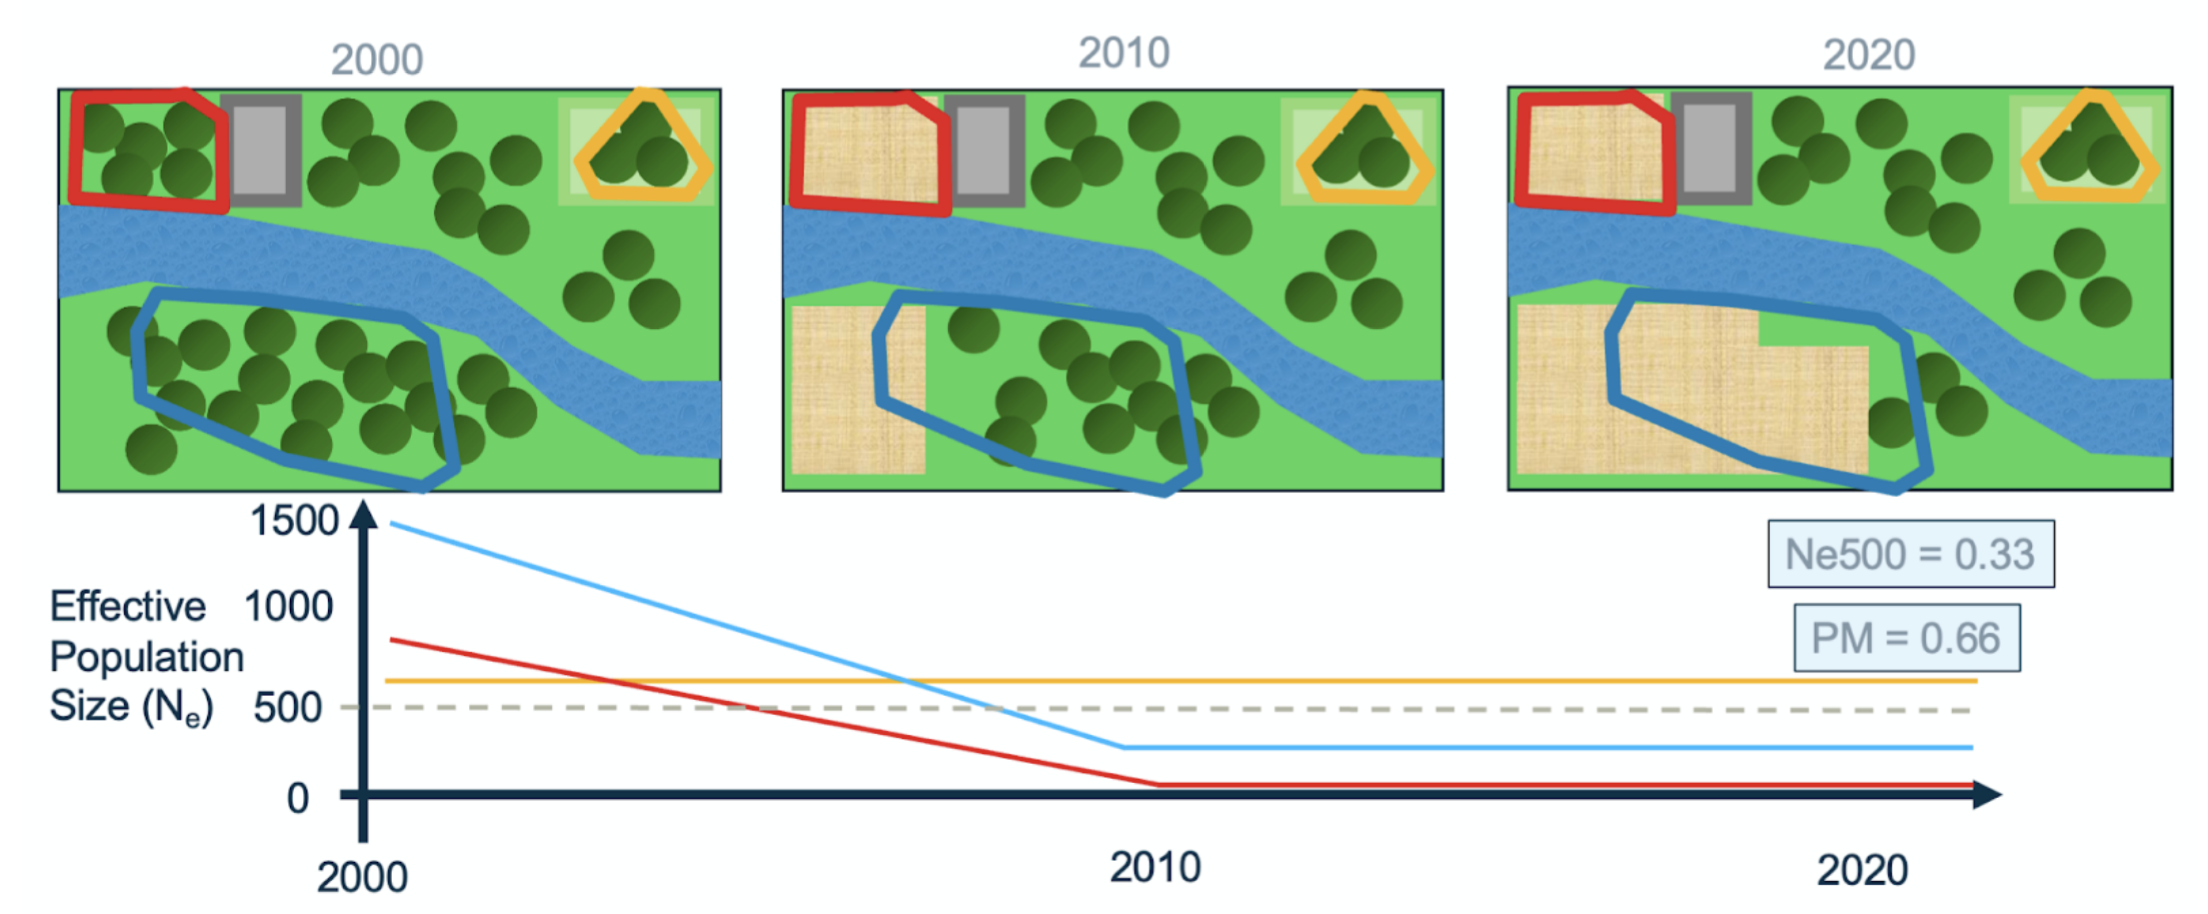
Calculating genetic diversity indicators: Based on temporal changes in suitable habitat area across populations, the tool estimates corresponding changes in population size for each population. These estimates are then used to compute the genetic diversity indicators Ne500 (proportion of populations above the effective population size threshold of 500) and PM (proportion of populations maintaining stable size over time).
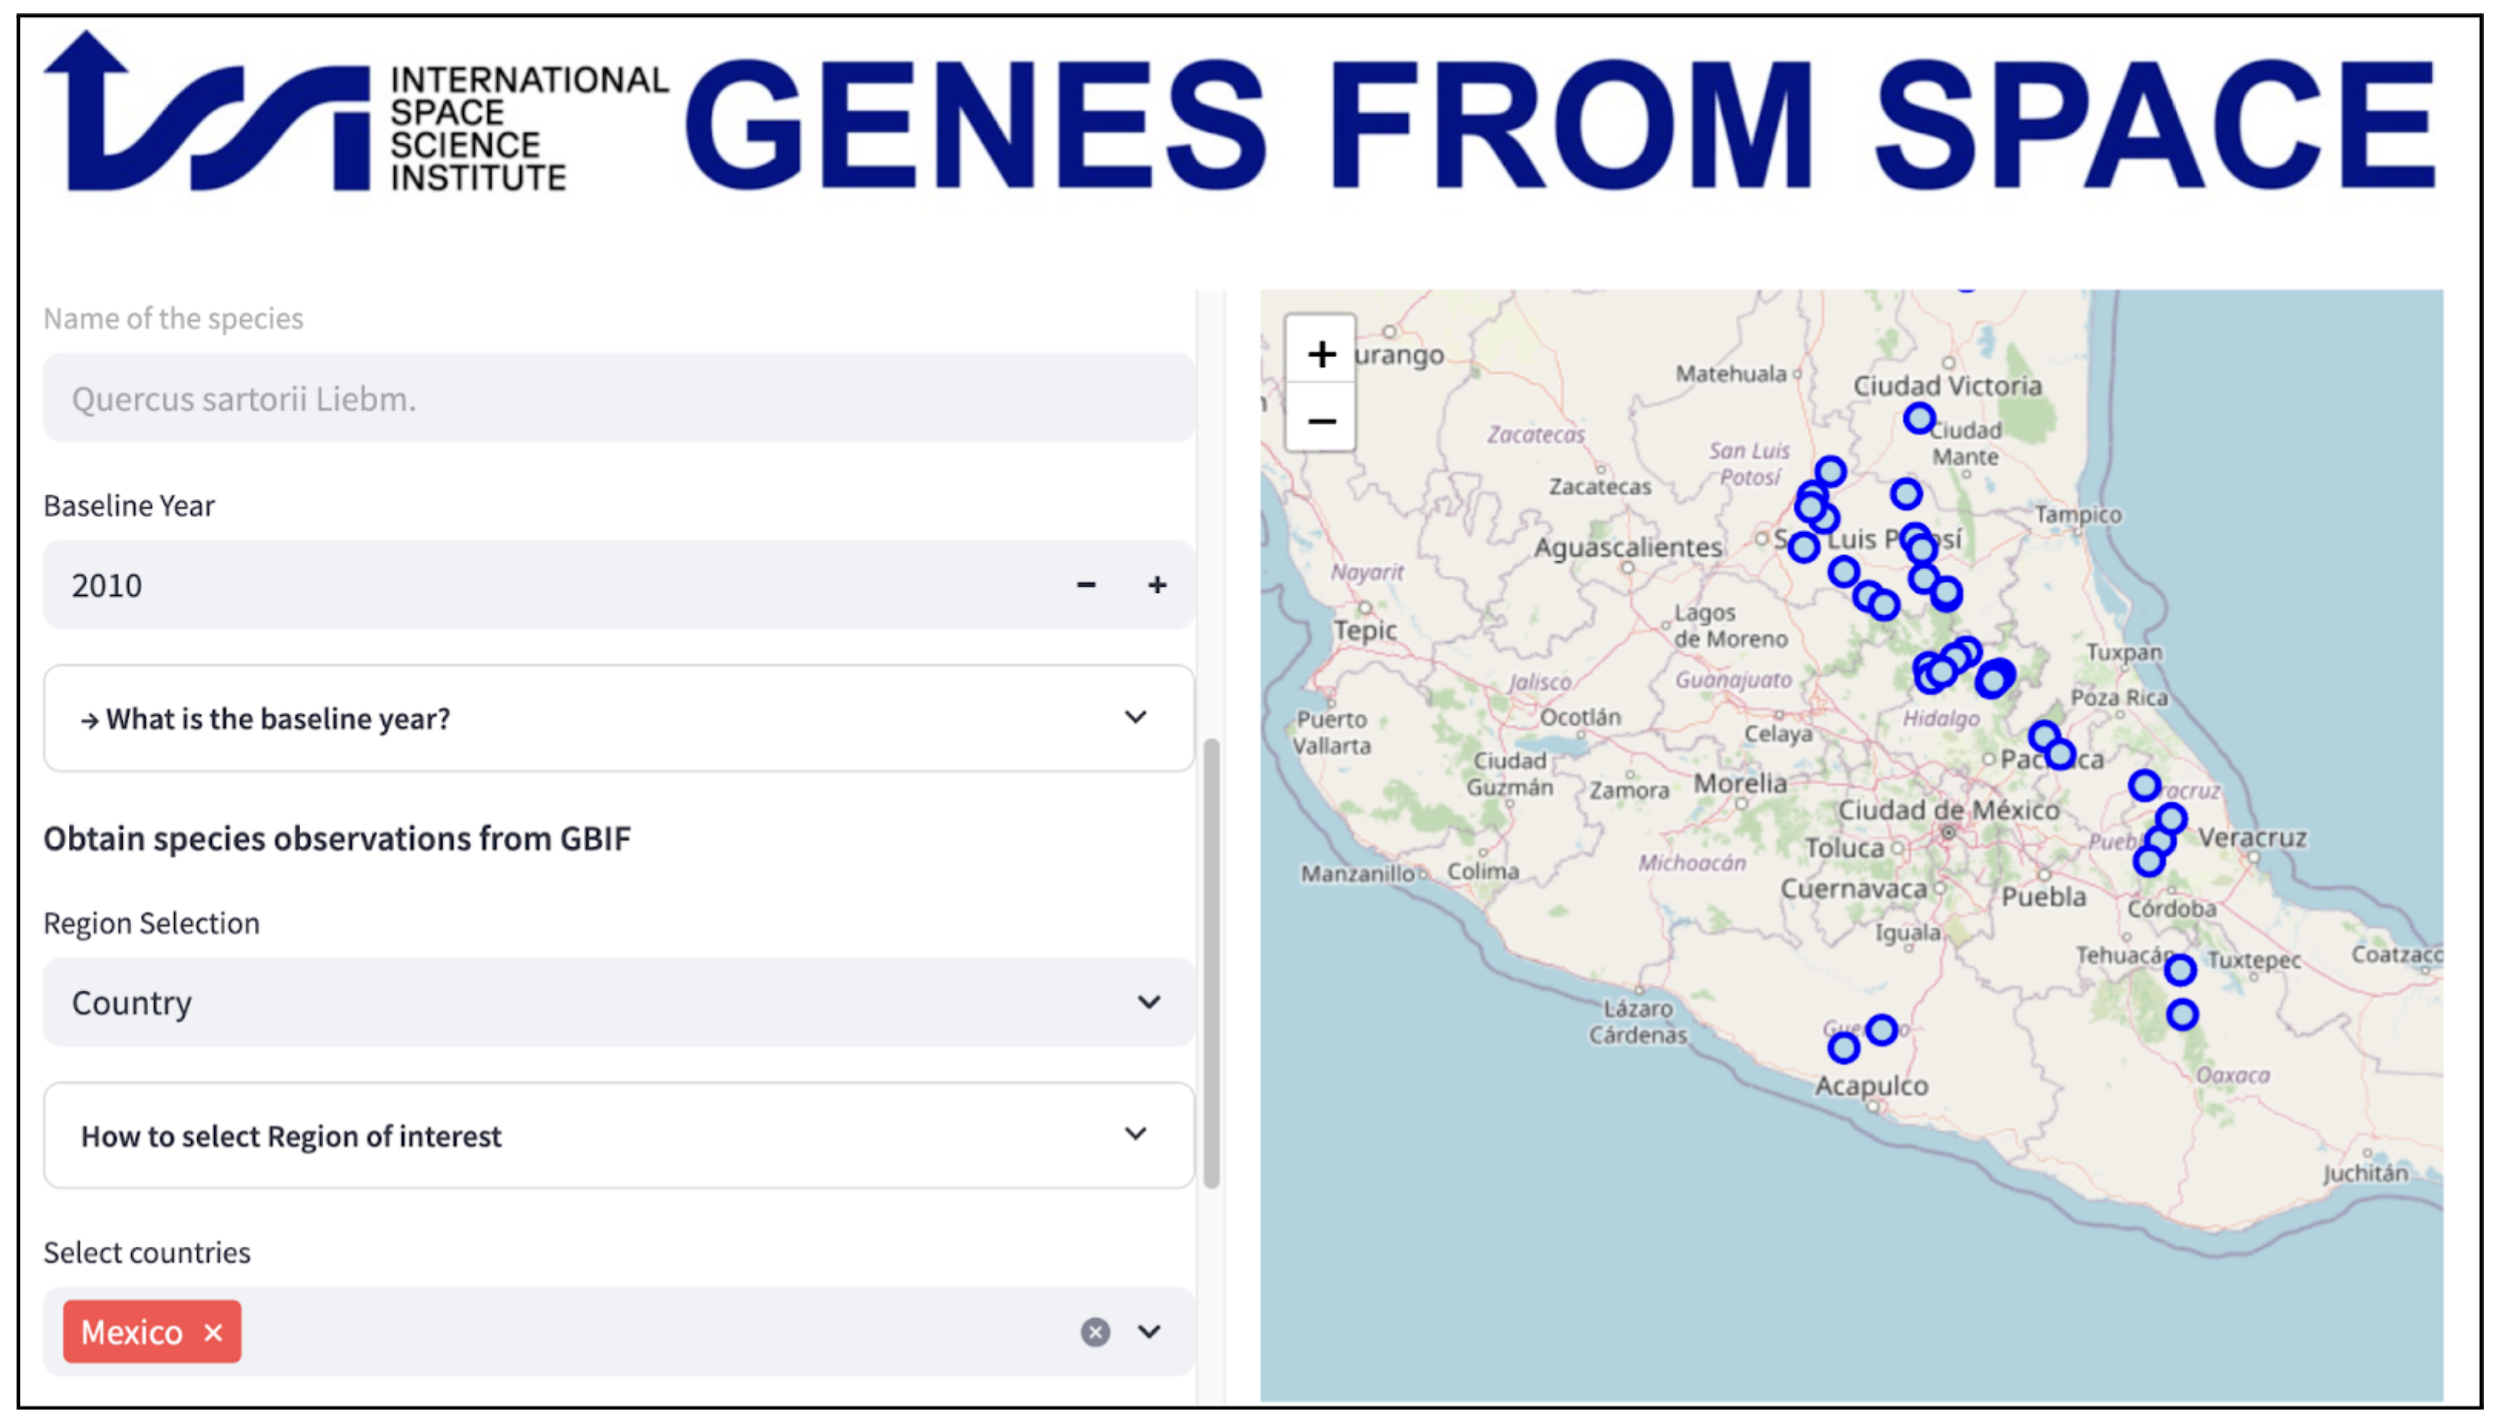
The Genes from Space monitoring tool will be accessible through an intuitive, interactive web interface. The will guide users in preparing the required input data via interactive maps and visual elements, and allow users to explore the resulting genetic diversity indicator predictions dynamically through the same interface. The beta version of the interactive tool is available at https://www.gfstool.com/.
Schuman, M. C., Röösli, C., Mastretta-Yanes, A., Helfenstein, I. S., Vernesi, C., Selmoni, O., Millette, K. L., Tobón-Niedfeldt, W., Albergel, C., Leigh, D., Hebden, S., Schaepman, M. E., Laikre, L., & Asrar, G. R. (2024). Genes from space: Leveraging Earth Observation satellites to monitor genetic diversity. https://ecoevorxiv.org/repository/view/7274/