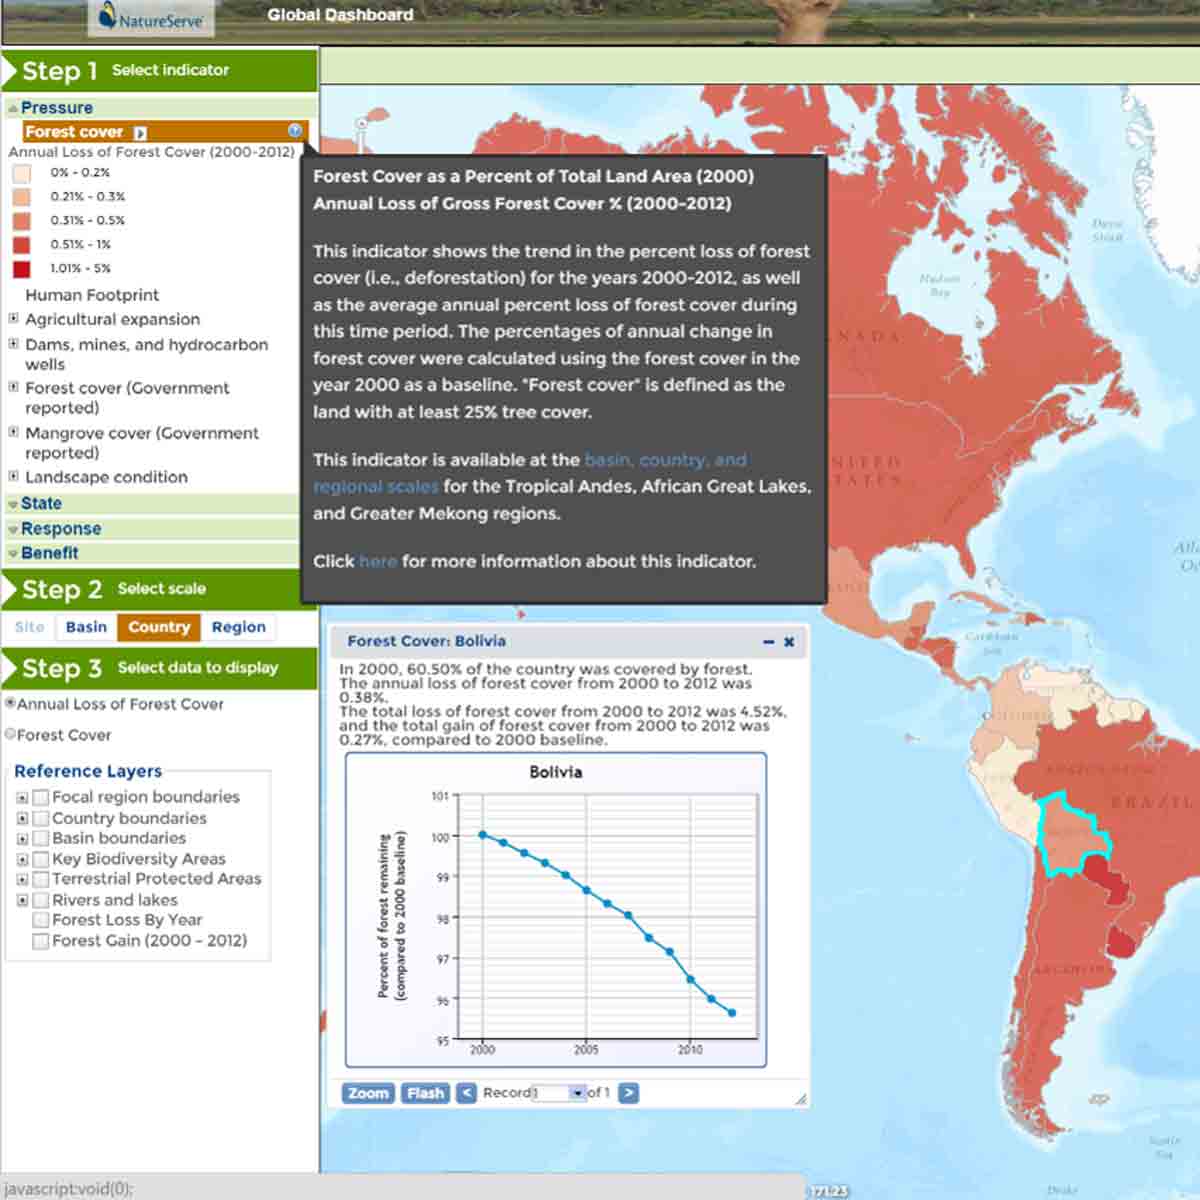
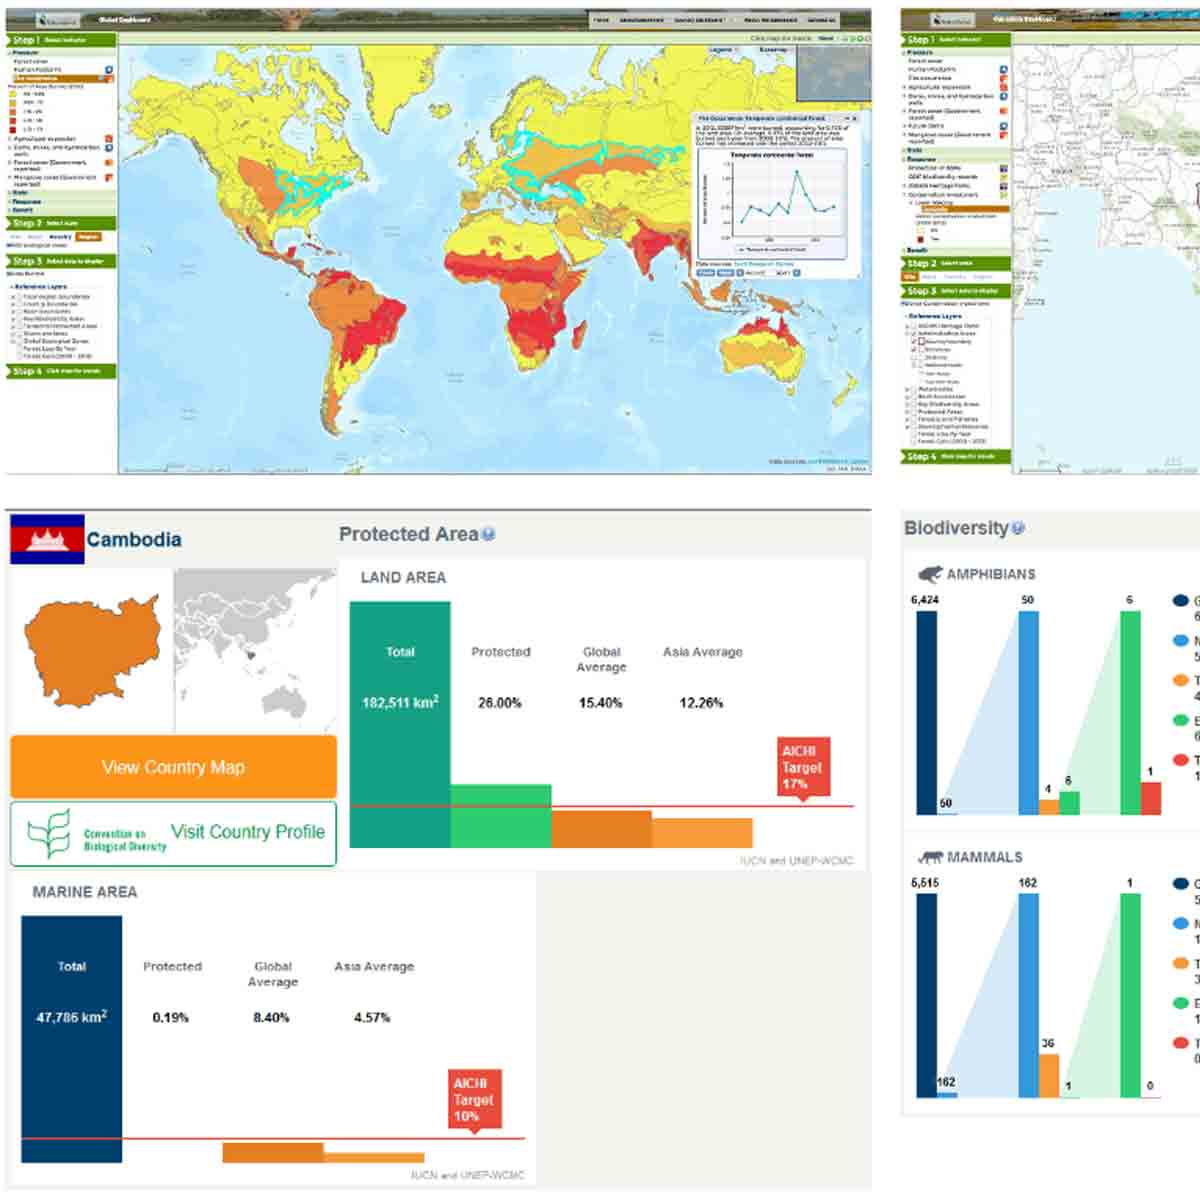
The Biodiversity Indicators Dashboard provides conservation practitioners and policy makers with a quick but comprehensive view of the status and trends of biodiversity and conservation actions at regional, national, and river basin scales. Through indicator data visualizations using charts, graphs, and maps, the Biodiversity Indicators Dashboard a ...
Last Update: 2019
Data reporting Genetic composition Species populations Community composition Ecosystem structure Ecosystem function
Login to add the tool into your favorites.
The Biodiversity Indicators Dashboard provides conservation practitioners and policy makers with a quick but comprehensive view of the status and trends of biodiversity and conservation actions at regional, national, and river basin scales. Through indicator data visualizations using charts, graphs, and maps, the Biodiversity Indicators Dashboard assembles information on a range of factors that reflect trends in the health of species and ecosystems as well as the threats to biodiversity. The indicators in the Dashboard are grouped using the Pressure, State, Benefit, Response (PSBR) framework. Each indicator fits into one of four categories: Pressure, State, Benefit, or Response. The framework describes the relationship between the pressures human societies put on the state of ecosystem health; the benefits to human societies of improving the state of ecosystem health; and the responses designed to increase these benefits by reducing pressures. For example, the establishment of protected areas (conservation response) is predicted to reduce deforestation (pressure), which should in turn improve ecosystem health (state) and improve the quality of freshwater flowing to downstream human populations (benefit). The Biodiversity Indicators Dashboard now has global coverage for many indicators. Other indicators are available for more restricted geographies, including a number that focus on three regions: Tropical Andes, African Great Lakes, and Greater Mekong, with data for 22 countries. Global updates are planned for some of these in the future.
| Contact person: | Mike Gill |
|---|---|
| Contact e-mail: | mike.gill@natureserve.org |
| Contact Organization: | NatureServe |
| URL(s): | http://dashboard.natureserve.org |
Login to add a review for the tool Biodiversity Indicators Dashboard